In my talk about the Security Manager, I demo a hacks that takes advantage of the Attach API. The later requires to know about the PID of the JVM one wants to attach to. Because my good friend Evgeny Mandrikov couldn’t attend the talk at Devoxx Ukraine, I did a quick private demo just for him.
To get the PID of the JVM I wanted to attach to, I used the ps -ef | grep java command.
At that point, Evgeny told me about the jps command, and I understood there were a lot of JDK commands I didn’t know about, besides the most common ones.
Here’s a list about the ones that are useful to fix issues on deployed applications.
jps: print running JVMs
To display a list of running JVMs, with more or less data, use the jps command-line utility tool.
You use the
jpscommand to list the instrumented JVMs on the target system. This command is experimental and unsupported.
jps was introduced in Java 6.
That tells a lot about what "experimental" truly means.
|
jpsBy default, the list displays only the PID and the launched class' simple name (or the launched JAR’s name):
560   Jps
99714 spring-petclinic-2.0.0.BUILD-SNAPSHOT.jar
95689 CommandServer
Additional options allow to display more data:
| Option | Description |
|---|---|
|
Displays the fully-qualified class name, or the JAR’s full path |
|
Displays arguments used to launch the JVM e.g. |
|
Displays parameters passed to the application e.g. the |
With the state of the system, here’s the output will all above options enabled:
99714 target/spring-petclinic-2.0.0.BUILD-SNAPSHOT.jar
679   sun.tools.jps.Jps -lvm -Xms8m \
          -Dapplication.home=/Library/Java/JavaVirtualMachines/jdk1.8.0_181.jdk/Contents/Home
95689 org.asciidoctor.diagram.CommandServer -Djava.awt.headless=true
jinfo: print launch data on a JVM
Production issues require to get additional information about a specific running JVM. This data includes the whole set of JVM flags, JVM arguments and system properties.
You use the jinfo command to generate Java configuration information for a specified Java process. This command is experimental and unsupported.
jinfo 95689This is a sample result (abridged and formatted for better readability):
Java System Properties:
#Fri Dec 07 16:22:25 CET 2018
    gopherProxySet=false
    awt.toolkit=sun.lwawt.macosx.LWCToolkit
    java.specification.version=11
    sun.cpu.isalist=
    sun.jnu.encoding=UTF-8
    ...
    java.class.version=55.0
    socksNonProxyHosts=local|*.local|169.254/16|*.169.254/16

VM Flags:
    -XX:CICompilerCount=3
    -XX:ConcGCThreads=1
    -XX:G1ConcRefinementThreads=4
    -XX:G1HeapRegionSize=1048576
    -XX:GCDrainStackTargetSize=64
    -XX:InitialHeapSize=268435456
    -XX:MarkStackSize=4194304
    -XX:MaxHeapSize=4294967296
    -XX:MaxNewSize=2576351232
    -XX:MinHeapDeltaBytes=1048576
    -XX:NonNMethodCodeHeapSize=5830092
    -XX:NonProfiledCodeHeapSize=122914074
    -XX:ProfiledCodeHeapSize=122914074
    -XX:ReservedCodeCacheSize=251658240
    -XX:+SegmentedCodeCache
    -XX:+UseCompressedClassPointers
    -XX:+UseCompressedOops
    -XX:+UseFastUnorderedTimeStamps
    -XX:+UseG1GC

VM Arguments:
    jvm_args:
        -Djava.awt.headless=true
    java_command:
        org.asciidoctor.diagram.CommandServer
    java_class_path (initial):
        ~/.rbenv/versions/2.5.1/lib/ruby/gems/2.5.0/gems/asciidoctor-diagram-1.5.9/lib/server-1.3.13.jar:
        ~/.rbenv/versions/2.5.1/lib/ruby/gems/2.5.0/gems/asciidoctor-diagram-1.5.9/lib/ditaa-1.3.13.jar:
        ~/.rbenv/versions/2.5.1/lib/ruby/gems/2.5.0/gems/asciidoctor-diagram-1.5.9/lib/ditaamini-0.11.jar:
        ~/.rbenv/versions/2.5.1/lib/ruby/gems/2.5.0/gems/asciidoctor-diagram-1.5.9/lib/plantuml-1.3.13.jar:
        ~/.rbenv/versions/2.5.1/lib/ruby/gems/2.5.0/gems/asciidoctor-diagram-1.5.9/lib/plantuml.jar:
        ~/.rbenv/versions/2.5.1/lib/ruby/gems/2.5.0/gems/asciidoctor-diagram-1.5.9/lib/jlatexmath-minimal-1.0.5.jar:
        ~/.rbenv/versions/2.5.1/lib/ruby/gems/2.5.0/gems/asciidoctor-diagram-1.5.9/lib/batik-all-1.7.jar
Launcher Type: SUN_STANDARD
Options allow to restrict what is displayed:
| Option | Description |
|---|---|
|
Displays only flag-related information |
|
Displays only system properties |
jmap: print class-related data on a JVM
Next, it’s necessary to get insight on class-related data on the JVM: class loader statistics, objects awaiting finalization and object heap.
You use the jmap command to print details of a specified process. This command is experimental and unsupported.
Depending on the option used, the output is different.
- To print class loader statistics
-
jmap -clstats 95689Index Super InstBytes KlassBytes annotations CpAll MethodCount Bytecodes MethodAll ROAll RWAll Total ClassName 1 -1 1686600 504 0 0 0 0 0 24 616 640 [B 2 -1 485288 504 0 0 0 0 0 24 616 640 [I 3 20 420984 616 128 14224 109 4577 64472 18640 62104 80744 java.lang.String 4 -1 375216 504 0 0 0 0 0 24 616 640 [C 5 20 374448 672 0 22120 139 5682 46936 24616 47008 71624 java.lang.Class 6 -1 238888 504 0 0 0 0 0 24 616 640 [Ljava.lang.Object; 7 20 165440 584 0 1392 7 149 1864 1152 3008 4160 java.util.HashMap$Node 8 20 141856 592 0 1368 9 213 2776 1488 3584 5072 java.util.concurrent.ConcurrentHashMap$Node 9 20 71120 584 0 1400 7 171 2264 1208 3384 4592 java.util.TreeMap$Entry ... 3085 3084 0 632 0 808 5 71 960 640 1920 2560 sun.util.resources.TimeZoneNamesBundle 3086 20 0 600 0 1256 5 159 1000 856 2264 3120 sun.util.resources.provider.NonBaseLocaleDataMetaInfo 5147912 1947360 10656 6473512 31831 1647775 9869272 6170712 13100408 19271120 Total 26.7% 10.1% 0.1% 33.6% - 8.6% 51.2% 32.0% 68.0% 100.0% Index Super InstBytes KlassBytes annotations CpAll MethodCount Bytecodes MethodAll ROAll RWAll Total ClassName - To print histogram of java object heap
-
jmap -histo 95689num #instances #bytes class name (module) ------------------------------------------------------- 1: 2578716 182530328 [I (java.base@11.0.1) 2: 261988 71251184 [Z (java.base@11.0.1) 3: 798811 57514392 java.util.regex.Matcher (java.base@11.0.1) 4: 413769 28433240 [B (java.base@11.0.1) 5: 296086 26055568 java.util.regex.Pattern (java.base@11.0.1) 6: 301073 16858024 [Ljava.lang.Object; (java.base@11.0.1) 7: 276719 15496264 [Ljava.util.regex.Pattern$GroupHead; (java.base@11.0.1) 8: 798811 13032760 [Ljava.util.regex.IntHashSet; (java.base@11.0.1) 9: 318781 7650744 java.util.regex.Pattern$BmpCharProperty (java.base@11.0.1) 10: 289648 6951552 java.util.ArrayList (java.base@11.0.1) ... 1616: 1 16 sun.util.logging.PlatformLogger (java.base@11.0.1) 1617: 1 16 sun.util.resources.LocaleData$LocaleDataStrategy (java.base@11.0.1) 1618: 1 16 sun.util.resources.cldr.provider.CLDRLocaleDataMetaInfo (jdk.localedata@11.0.1) Total 10605127 526098920
jstack: print threads of a JVM
Then, if the issue is related to threads (e.g. deadlocks or livelocks), detailed data on running threads come in handy.
You use the jstack command to print Java stack traces of Java threads for a specified Java process. This command is experimental and unsupported.
jstack 956892018-12-07 19:06:01
Full thread dump OpenJDK 64-Bit Server VM (11.0.1+13 mixed mode):
Threads class SMR info:
_java_thread_list=0x00007fd1212fb270, length=13, elements={
0x00007fd120015800, 0x00007fd120051000, 0x00007fd120053800, 0x00007fd11e89c000,
0x00007fd120045800, 0x00007fd11f00f800, 0x00007fd12004a800, 0x00007fd11e8d9800,
0x00007fd120065000, 0x00007fd11f883000, 0x00007fd11f075800, 0x00007fd11ed4b000,
0x00007fd11f30e800
}
"main" #1 prio=5 os_prio=31 cpu=314567.92ms elapsed=2035.03s tid=0x00007fd120015800 nid=0x2403 runnable [0x000070000bbac000]
java.lang.Thread.State: RUNNABLE
at java.net.SocketInputStream.socketRead0(java.base@11.0.1/Native Method)
at java.net.SocketInputStream.socketRead(java.base@11.0.1/SocketInputStream.java:115)
at java.net.SocketInputStream.read(java.base@11.0.1/SocketInputStream.java:168)
at java.net.SocketInputStream.read(java.base@11.0.1/SocketInputStream.java:140)
at java.io.BufferedInputStream.fill(java.base@11.0.1/BufferedInputStream.java:252)
at java.io.BufferedInputStream.read(java.base@11.0.1/BufferedInputStream.java:271)
- locked <0x00000007000d0558> (a java.io.BufferedInputStream)
at org.asciidoctor.diagram.HTTPInputStream.readLine(HTTPInputStream.java:20)
at org.asciidoctor.diagram.HTTPInputStream.readRequest(HTTPInputStream.java:56)
at org.asciidoctor.diagram.CommandServer.processRequests(CommandServer.java:61)
at org.asciidoctor.diagram.CommandServer.main(CommandServer.java:25)
...
"process reaper" #109 daemon prio=10 os_prio=31 cpu=538.50ms elapsed=1683.17s tid=0x00007fd11f30e800 nid=0x6507 waiting on condition [0x000070000ba4e000]
java.lang.Thread.State: TIMED_WAITING (parking)
at jdk.internal.misc.Unsafe.park(java.base@11.0.1/Native Method)
- parking to wait for <0x000000070016fe20> (a java.util.concurrent.SynchronousQueue$TransferStack)
at java.util.concurrent.locks.LockSupport.parkNanos(java.base@11.0.1/LockSupport.java:234)
at java.util.concurrent.SynchronousQueue$TransferStack.awaitFulfill(java.base@11.0.1/SynchronousQueue.java:462)
at java.util.concurrent.SynchronousQueue$TransferStack.transfer(java.base@11.0.1/SynchronousQueue.java:361)
at java.util.concurrent.SynchronousQueue.poll(java.base@11.0.1/SynchronousQueue.java:937)
at java.util.concurrent.ThreadPoolExecutor.getTask(java.base@11.0.1/ThreadPoolExecutor.java:1053)
at java.util.concurrent.ThreadPoolExecutor.runWorker(java.base@11.0.1/ThreadPoolExecutor.java:1114)
at java.util.concurrent.ThreadPoolExecutor$Worker.run(java.base@11.0.1/ThreadPoolExecutor.java:628)
at java.lang.Thread.run(java.base@11.0.1/Thread.java:834)
"VM Thread" os_prio=31 cpu=1139.30ms elapsed=2035.01s tid=0x00007fd11f88e000 nid=0x4b03 runnable
"GC Thread#0" os_prio=31 cpu=1888.39ms elapsed=2035.03s tid=0x00007fd11e805000 nid=0x5203 runnable
"GC Thread#1" os_prio=31 cpu=1951.89ms elapsed=2034.53s tid=0x00007fd11e8e1800 nid=0x9903 runnable
"GC Thread#2" os_prio=31 cpu=1897.20ms elapsed=2034.53s tid=0x00007fd11e8e2800 nid=0x5f03 runnable
"GC Thread#3" os_prio=31 cpu=1901.78ms elapsed=2034.53s tid=0x00007fd11e90d000 nid=0x6103 runnable
"G1 Main Marker" os_prio=31 cpu=0.57ms elapsed=2035.03s tid=0x00007fd11e84a000 nid=0x5003 runnable
"G1 Conc#0" os_prio=31 cpu=36.31ms elapsed=2035.03s tid=0x00007fd11e84a800 nid=0x3003 runnable
"G1 Refine#0" os_prio=31 cpu=8.48ms elapsed=2035.03s tid=0x00007fd11f882000 nid=0x3203 runnable
"G1 Refine#1" os_prio=31 cpu=2.95ms elapsed=2034.52s tid=0x00007fd11e9b1000 nid=0x9703 runnable
"G1 Refine#2" os_prio=31 cpu=0.06ms elapsed=2034.36s tid=0x00007fd11f939800 nid=0x6303 runnable
"G1 Young RemSet Sampling" os_prio=31 cpu=898.32ms elapsed=2035.03s tid=0x00007fd11e858800 nid=0x3303 runnable
"VM Periodic Task Thread" os_prio=31 cpu=933.68ms elapsed=2034.94s tid=0x00007fd11f00c800 nid=0xa603 waiting on condition
JNI global refs: 98, weak refs: 5
To check for locks, use the -l option.
This prints the following:
...
"main" #1 prio=5 os_prio=31 cpu=489307.36ms elapsed=3019.58s tid=0x00007fd120015800 nid=0x2403 runnable  [0x000070000bbac000]
   java.lang.Thread.State: RUNNABLE
	at java.net.SocketInputStream.socketRead0(java.base@11.0.1/Native Method)
	at java.net.SocketInputStream.socketRead(java.base@11.0.1/SocketInputStream.java:115)
	at java.net.SocketInputStream.read(java.base@11.0.1/SocketInputStream.java:168)
	at java.net.SocketInputStream.read(java.base@11.0.1/SocketInputStream.java:140)
	at java.io.BufferedInputStream.fill(java.base@11.0.1/BufferedInputStream.java:252)
	at java.io.BufferedInputStream.read(java.base@11.0.1/BufferedInputStream.java:271)
	- locked <0x00000007000d0558> (a java.io.BufferedInputStream)
	at org.asciidoctor.diagram.HTTPInputStream.readLine(HTTPInputStream.java:20)
	at org.asciidoctor.diagram.HTTPInputStream.readRequest(HTTPInputStream.java:56)
	at org.asciidoctor.diagram.CommandServer.processRequests(CommandServer.java:61)
	at org.asciidoctor.diagram.CommandServer.main(CommandServer.java:25)

   Locked ownable synchronizers: (1)
	- None

"Reference Handler" #2 daemon prio=10 os_prio=31 cpu=0.94ms elapsed=3019.55s tid=0x00007fd120051000 nid=0x3603 waiting on condition  [0x000070000c2c1000]
   java.lang.Thread.State: RUNNABLE
	at java.lang.ref.Reference.waitForReferencePendingList(java.base@11.0.1/Native Method)
	at java.lang.ref.Reference.processPendingReferences(java.base@11.0.1/Reference.java:241)
	at java.lang.ref.Reference$ReferenceHandler.run(java.base@11.0.1/Reference.java:213)

   Locked ownable synchronizers: (1)
	- None
...
| 1 | Look, no locks! |
jconsole: monitor a JVM
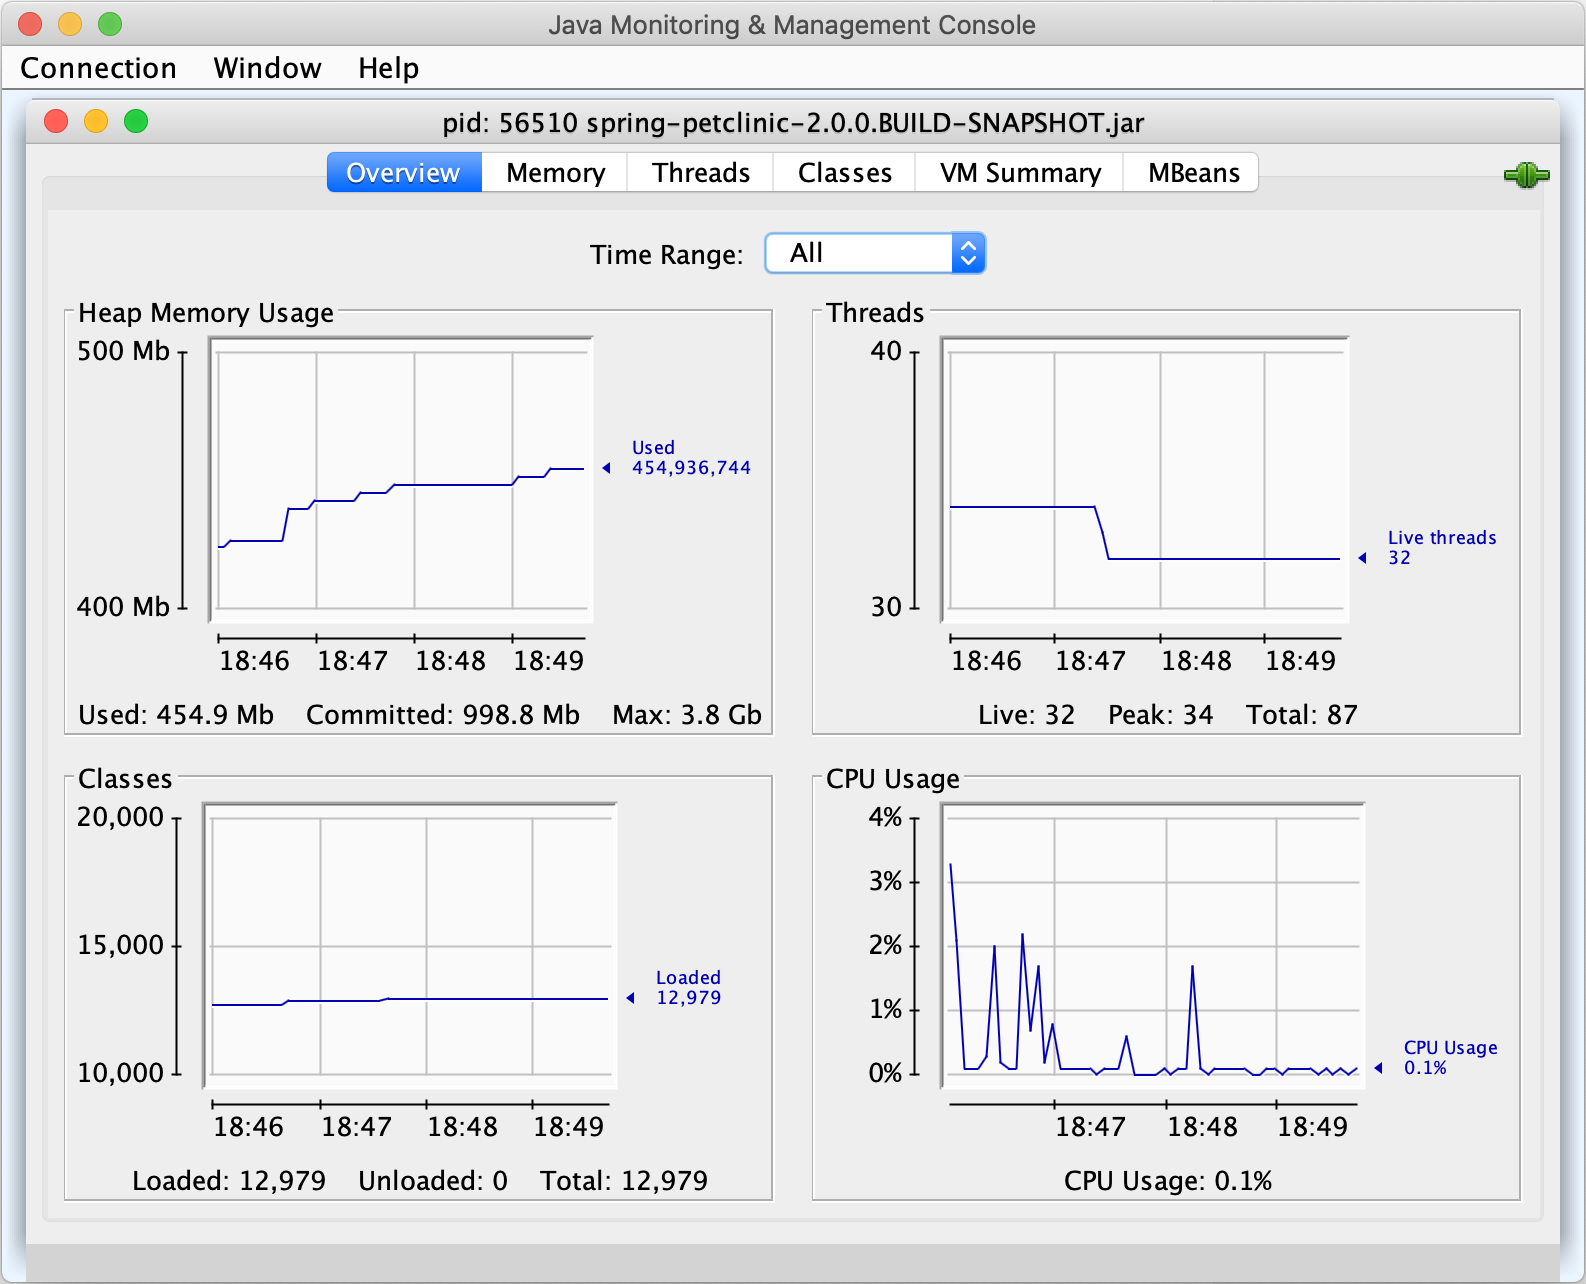
Having a graphical view of the insides of a running JVM can be a life saver.
You use the
jconsolecommand to start a graphical console to monitor and manage Java applications.
IMHO, JConsole is one of the most important tool in the Java developer’s toolbelt.

It offers a graphical view of a running JVM, on key areas:
- Memory
-
The console is able to display different memory-related graphs: heap, non-heap, old gen, eden, survivor, etc.
- Threads
-
JConsole can display the evolution of the number of threads across a selected time range. It also can show each individual thread separately, along with its name, its status and its stack.
- Classes
-
It can also display the number of classes loaded.
- VM Summary
-
The tool can show data related to the JVM:
- VM arguments
- Class path
- Library path
- Boot class path
- Heap size
- etc.
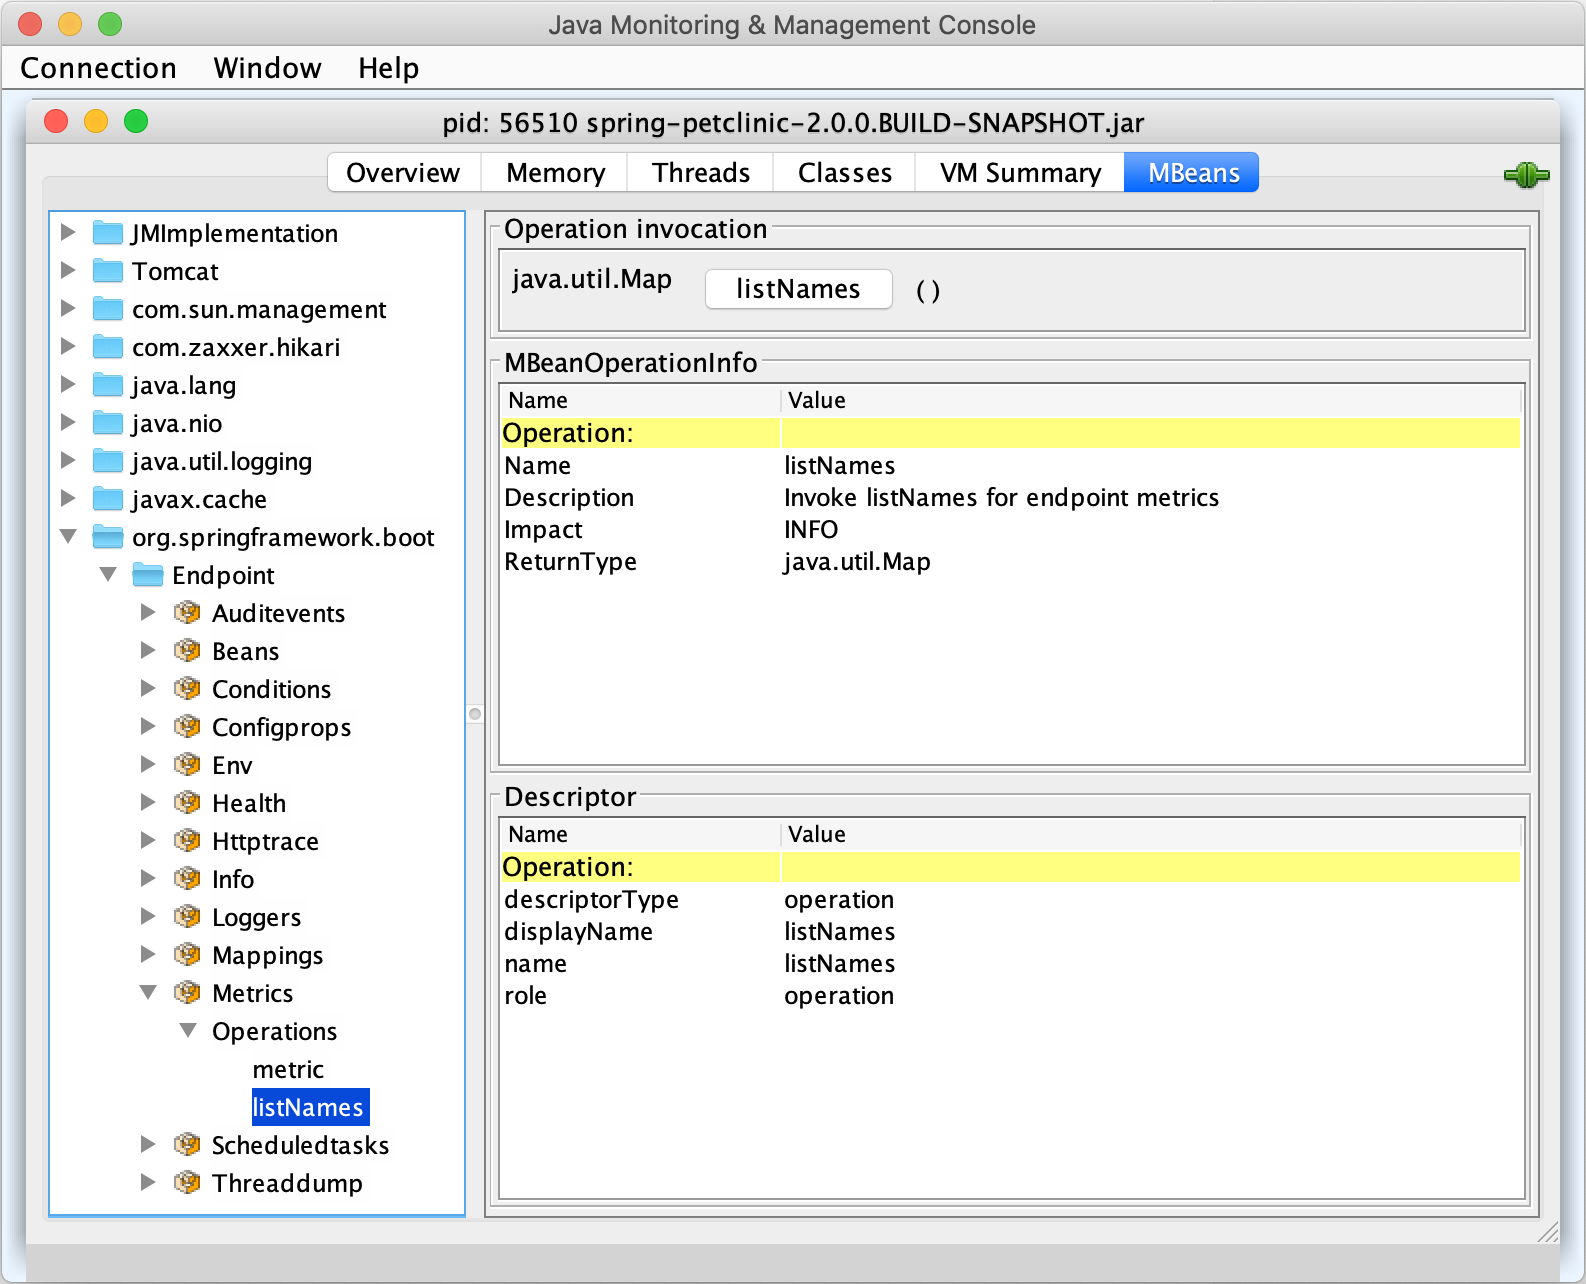
- MBeans
-
JConsole is able to display all available MBeans in a tree-like structure, including attributes and methods. Moreover, it allows to set their attributes, and call their methods.

JConsole is based on a plugin architecture.
Conclusion
The JDK offers a lot of out-of-box tools to help developers. Whether you’re a using an IDE or not, they are a huge asset in a developer’s day-to-day job.

