With DevOps, metrics are starting to be among the non-functional requirements any application has to bring into scope. Before going further, there are several comments I’d like to make:
- Metrics are not only about non-functional stuff. Many metrics represent very important KPI for the business. For example, for an e-commerce shop, the business needs to know how many customers leave the checkout process, and in which screen. True, there are several solutions to achieve this, though they are all web-based (Google Analytics comes to mind) and metrics might also be required for different architectures. And having all metrics in the same backend mean they can be correlated easily.
- Metrics, as any other NFR (e.g. logging and exception handling) should be designed and managed upfront and not pushed in as an afterthought. How do I know that? Well, one of my last project focused on functional requirement only, and only in the end did project management realized NFR were important. Trust me when I say it was gory - and it has cost much more than if designed in the early phases of the project.
- Metrics have an overhead. However, without metrics, it’s not possible to increase performance. Just accept that and live with it.
The inputs are the following: the application is Spring MVC-based and metrics have to be aggregated in Graphite. We will start by using the excellent Metrics project: not only does it get the job done, its documentation is of very high quality and it’s available under the friendly OpenSource Apache v2.0 license.
That said, let’s imagine a "standard" base architecture to manage those components.
First, though Metrics offer a Graphite endpoint, this requires configuration in each environment and this makes it harder, especially on developers workstations. To manage this, we’ll send metrics to JMX and introduce jmxtrans as a middle component between JMX and graphite. As every JVM provides JMX services, this requires no configuration when there’s none needed - and has no impact on performance.
Second, as developers, we usually enjoy develop everything from scratch in order to show off how good we are - or sometimes because they didn’t browse the documentation. My point of view as a software engineer is that I’d rather not reinvent the wheel and focus on the task at end. Actually, Spring Boot already integrates with Metrics through the Actuator component. However, it only provides GaugeService - to send unique values, and CounterService - to increment/decrement values. This might be good enough for FR but not for NFR so we might want to tweak things a little.
The flow would be designed like this: Code > Spring Boot > Metrics > JMX > Graphite
The starting point is to create an aspect, as performance metric is a cross-cutting concern:
@Aspect
public class MetricAspect {

    private final MetricSender metricSender;

    @Autowired
    public MetricAspect(MetricSender metricSender) {
        this.metricSender = metricSender;
    }

    @Around("execution(* ch.frankel.blog.metrics.ping..*(..)) ||execution(* ch.frankel.blog.metrics.dice..*(..))")
    public Object doBasicProfiling(ProceedingJoinPoint pjp) throws Throwable {

        StopWatch stopWatch = metricSender.getStartedStopWatch();

        try {
            return pjp.proceed();
        } finally {
            Class<?> clazz = pjp.getTarget().getClass();
            String methodName = pjp.getSignature().getName();
            metricSender.stopAndSend(stopWatch, clazz, methodName);
        }
    }
}
The only thing outside of the ordinary is the usage of autowiring as aspects don’t seem to be able to be the target of explicit wiring (yet?). Also notice the aspect itself doesn’t interact with the Metrics API, it only delegates to a dedicated component:
public class MetricSender {

    private final MetricRegistry registry;

    public MetricSender(MetricRegistry registry) {
        this.registry = registry;
    }

    private Histogram getOrAdd(String metricsName) {
        Map<String, Histogram> registeredHistograms = registry.getHistograms();
        Histogram registeredHistogram = registeredHistograms.get(metricsName);
        if (registeredHistogram == null) {
            Reservoir reservoir = new ExponentiallyDecayingReservoir();
            registeredHistogram = new Histogram(reservoir);
            registry.register(metricsName, registeredHistogram);
        }
        return registeredHistogram;
    }

    public StopWatch getStartedStopWatch() {
        StopWatch stopWatch = new StopWatch();
        stopWatch.start();
        return stopWatch;
    }

    private String computeMetricName(Class<?> clazz, String methodName) {
        return clazz.getName() + '.' + methodName;
    }

    public void stopAndSend(StopWatch stopWatch, Class<?> clazz, String methodName) {
        stopWatch.stop();
        String metricName = computeMetricName(clazz, methodName);
        getOrAdd(metricName).update(stopWatch.getTotalTimeMillis());
    }
}
The sender does several interesting things (but with no state):
- It returns a new
StopWatchfor the aspect to pass back after method execution - It computes the metric name depending on the class and the method
- It stops the
StopWatchand sends the time to theMetricRegistry - Note it also lazily creates and registers a new
Histogramwith anExponentiallyDecayingReservoirinstance. The default behavior is to provide anUniformReservoir, which keeps data forever and is not suitable for our need.
The final step is to tell the Metrics API to send data to JMX.
This can be done in one of the configuration classes, preferably the one dedicated to metrics, using the @PostConstruct annotation on the desired method.
@Configuration
public class MetricsConfiguration {

    @Autowired
    private MetricRegistry metricRegistry;

    @Bean
    public MetricSender metricSender() {
        return new MetricSender(metricRegistry);
    }

    @PostConstruct
    public void connectRegistryToJmx() {
        JmxReporter reporter = JmxReporter.forRegistry(metricRegistry).build();
        reporter.start();
    }
}
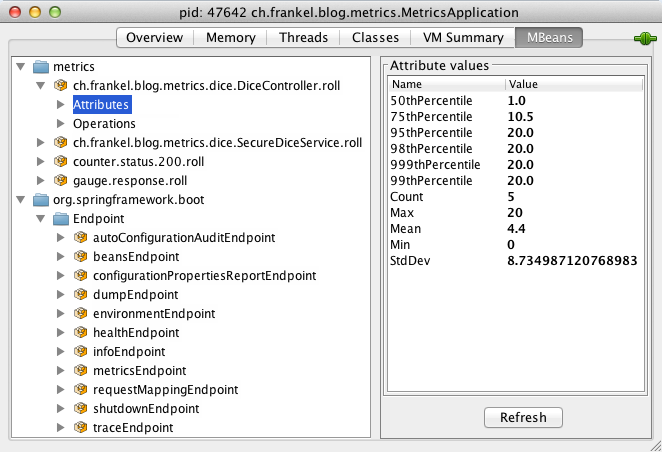
The JConsole should look like the following. Icing on the cake, all default Spring Boot metrics are also available:

Sources for this article are available in Maven "format".
