As a Java developer, when you are first shown how to run the JVM in debug mode, attach to it and then set a breakpoint, you really feel like you’ve reached a step on your developer journey. Well, at least I did. Now the world is going full microservice and knowing that trick means less and less in it everyday.
This week, I was playing with Logstash to see how I could send all of an application exceptions to an Elasticsearch instance, so I could display them on a Kibana dashboard for analytics purpose. Of course, nothing was seen in Elasticsearch at first. This post describes helped me toward making it work in the end.
The setup
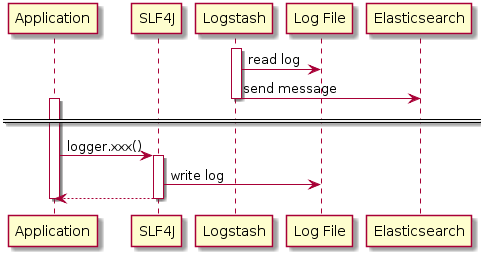
Components are the following:
- The application.
Since a lot of exceptions were necessary, I made use of the Java Bullshifier.
The only adaptation was to wire in some code to log exceptions in a log file.
public class ExceptionHandlerExecutor extends ThreadPoolExecutor { private static final Logger LOGGER = LoggerFactory.getLogger(ExceptionHandlerExecutor.class); public ExceptionHandlerExecutor(int corePoolSize, int maximumPoolSize, long keepAliveTime, TimeUnit unit, BlockingQueue<Runnable> workQueue) { super(corePoolSize, maximumPoolSize, keepAliveTime, unit, workQueue); } @Override protected void afterExecute(Runnable r, Throwable t) { if (r instanceof FutureTask) { FutureTask<Exception> futureTask = (FutureTask<Exception>) r; if (futureTask.isDone()) { try { futureTask.get(); } catch (InterruptedException | ExecutionException e) { LOGGER.error("Uncaught error", e); } } } } } - Logstash
- Elasticsearch
- Kibana

The first bump
Before being launched, Logstash needs to be configured - especially its input and its output.
There’s no out-of-the-box input focused on exception stack traces.
Those are multi-lines messages: hence, only lines starting with a timestamp mark the beginning of a new message.
Logstash achieves that with a specific codec including a regex pattern.
Some people, when confronted with a problem, think "I know, I’ll use regular expressions." Now they have two problems.
Some are better than others at regular expressions but nobody learned it as his/her mother tongue. Hence, it’s not rare to have errors. In that case, one should use one of the many available online regex validators. They are just priceless for understanding why some pattern doesn’t match.
The relevant Logstash configuration snippet becomes:
input {
  file {
    path => "/tmp/logback.log"
    start_position => "beginning"
    codec => multiline {
      pattern => "^\d{4}-\d{2}-\d{2} \d{2}:\d{2}:\d{2}"
      negate => true
      what => "previous"
    }
  }
}
The second bump
Now, data found its way into Elasticsearch, but message were not in the expected format. In order to analyze where this problem came from, messages can be printed on the console instead of indexed in Elasticsearch.
That’s quite easy with the following snippet:
output {
  stdout { codec => rubydebug }
}
With messages printed on the console, it’s possible to understand where the issue occurs.
In that case, I was able to tweak the input configuration (and add the forgotten negate ⇒ true bit).
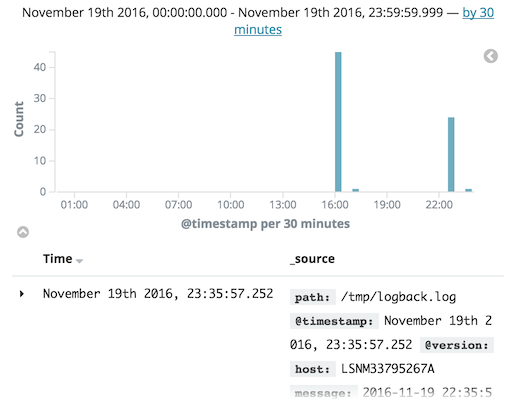
Finally, I got the expected result:

Conclusion
With more and more tools with every passing day, the toolbelt of the modern developer needs to increase as well. Unfortunately, there’s no one-size-fits-all solution: in order to know a tool’s every nook and cranny, one needs to use and re-use it, be creative, and search on Google… a lot.
